Pages
Stay In Touch
More
© 2026 The Somerville Times. All rights reserved.

Brickbottom Gallery, 1 Fitchburg Street, Somerville
Opening Reception: Friday, January 24, 7:00 – 9:00 p.m.
Show runs January 23 – February 22
Curated by Andrew Tang
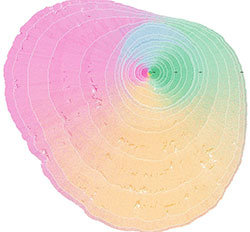
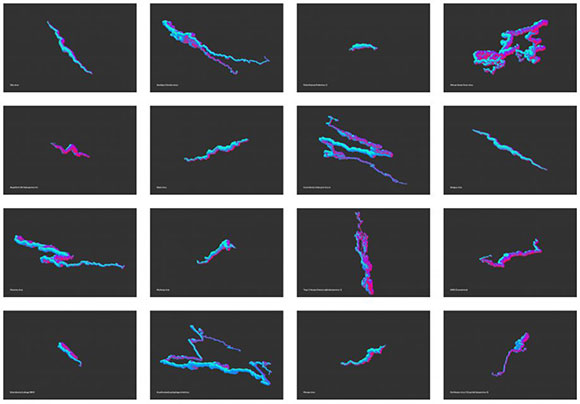
Curator’s statement: Data has become mainstream, the word and its associations have become jargon. Many think of spreadsheets when you mention data, and yes, that’s a great way to catalogue, filter and sort through data: the data that we are really good at collecting, gathering and curating. But the information on these spreadsheets are about life, human information, human interactions; it’s about us and the world around us.
Visualizing data is the process of using visual metaphors to make connections, sometimes emotional connections to the data we’ve spent years collecting. Using color for visual cues, texture, directionality, position, and contrast to name a few applications in highlighting unique characteristics or trends in the numbers. I will be exhibiting examples of data visualization, expanding the definition of what people think these words mean.


Reader Comments